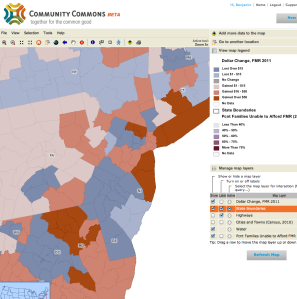
 Here’s a quick snapshot of housing affordability in Philadelphia using two Census indicators: median housing values and monthly owner costs. As you can see from these maps, there’s strong spatial variation between areas in Philly. I did the analysis at the Census-tract level, so each small polygon on the map roughly represents a neighborhood.
Median housing value is a useful indicator for a variety of reasons. One that might not be as obvious – housing is a major financial asset for many families. So not only does the indicator show where “nice” housing exists, it shows which neighborhoods stand to have a lot of value, provided homeownership opportunities exist. Continue reading

